Value or Numeric Filtering allows the user to filter data and items in queries using values. While Quick filtering offers a context-driven technique for settings and applying a filter through a point-and-click menu option, the Filter wizard dialog (covered in this topic) offers an ability to create one or more numerical or text filters with greater control over the filtering logic and mechanics. It is also the venue to edit and refine quick filters created through query interactions.
Note: When printing to Excel, CSV, JSON, or XML format, an option is displayed to remove value-based filters, so that the whole dataset is available for analysis. For more information, see Removing Value-Based Filters from Text Exports.
Understanding Value Filters and Slicers
Numeric or Value filters should not be confused with slicers. Given the broad range of capabilities in Pyramid, there are situations where these two types of filtering techniques overlap and converge. The easiest way to compare the different capabilities is to realize that:
- Value filters generally limit data by specifying limits on values and metrics; for example, find all customers who have more than 10 transactions; show all states starting with "New."
- Slicer filters generally limit data by limiting element selections using other element selections; for example, show me all customers who are in the USA (where USA can be selected as a slice).
To complicate matters, it's possible to have slicer selections impact value filter calculations. While it's also possible to have value filter operations drive the elements used to populate slicers (and subsequent selection filters). Indeed it's possible to have multiple cascading stages in a query with each of these cross-pollinating the other. This offers the analyst some powerful capabilities to build and execute extremely sophisticated queries to answer complex business questions.
Accessing the Filter wizard
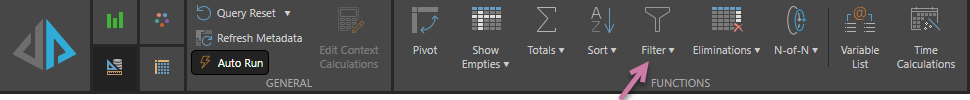
Select Filter from the Home or Query ribbon, right-click a column header or chart background (do not confuse this with the quick filter menu option), or click the context menu of the query info caption and choose Edit:

This opens the Filter wizard, where you can define and edit new filter sequences.
Tip: Remember that you can also create Filters using the Filter Drop Zone. Filters created in the Drop Zone cannot be edited in the Filter Wizard.
Filter Flow
Value filtering logic is broken into three main constructs:
- Targets:The first is the listing of elements to filter
- Settings: The second to is to choose the filter type and its settings
- Values: The last, which is sometimes optional, is to describe the values that will drive the filtering operation.
Filter Targets
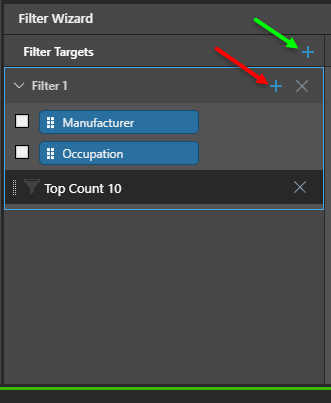
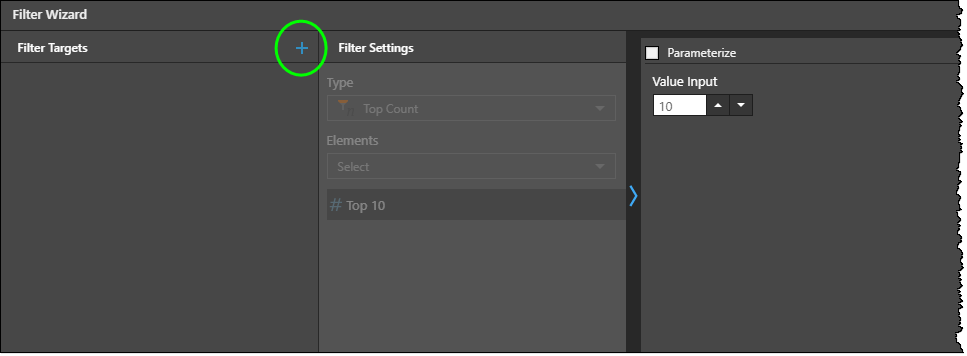
To add a filter target (the hierarchies that should be filtered), click the blue plus sign in the Filter Targets header (green arrow). From the Filter wizard, select the hierarchy or hierarchies to be filtered. You can elect to filter a single hierarchy of multi-hierarchy combination. You can add multiple target definitions to add different filtering logic for each target. For any given target sequence you can further nest more filter definitions, allowing you to filter the filter and so on (red arrow).
When adding a new filter, the member hierarchies within the query will appear as the basis of the filter. You can base your filtering preferences on any combination of the member hierarchies currently in the query, and any data point in your model even if those data points are not visible in the query.
Filter Settings
This panel contains the main options for filter in the query.
Filter Type
The filter type determines the overall filtering approach to be used in the given target sequence. The type options change depending on which approach is used.
|
Type |
Input |
Description |
|---|---|---|
|
Top Count & Bottom Count |
Count number |
the top or bottom n elements from a sorted list of elements based on numerical values. |
|
Top Percent & Bottom Percent |
Percentage value |
The top or bottom elements that are cumulatively larger or smaller than the percent figure of the result set. |
|
Top Sum & Bottom Sum |
Total value |
The top or bottom elements that are cumulatively larger or smaller than the aggregated figure. |
|
Filter Above & Filter Below |
Cut-off value |
Any elements that are higher or lower than the cut-off figure. |
|
Filter Between |
Upper and lower values |
Any elements that are between the two cut-off figures. |
|
Equals & Not Equals |
Target value |
The elements that have values that are equal to (or not equal to) the target amount. |
|
First & Last |
Count number |
The first or last n elements of the hierarchy presented in its natural order. |
|
Contains, Starts/Ends with, Exact |
Text |
Any elements with captions that match the search pattern provided. |
Notes:
- The text search options are only available on a single hierarchy selection
- The comparison values can be parameterized to allow end users to change the settings directly from the visual canvas.
- Data points used to drive the comparative values in all the relevant filters can be specified independently. See below.
Value
Certain filters will optionally prompt the user to supply a cut-off value (filter above, below, between, equals). Be default, the cut-off value is expected to be a simple numeric amount. However, statistical values can also be supplied to drive more advanced filtering outcomes.
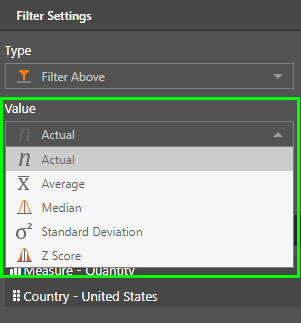
- Actual - a numerical amount to be supplied as an input (below)
- Average - a statistical measure of the average for the current query - does NOT require further input
- Median - a statistical measure of the median or 50th percentile value for the current query - does NOT require further input
- Standard Deviation - a statistical measure of the standard deviations from the mean for the current query. The number of standard deviations to supplied as input.
- Z score - a statistical measure of the z-score the current query. The number of z-score to supplied as input.
Select or Deselect Elements
This switch provides a mechanism to perform the standard "positive" filter or to run the opposite "negative" filter operation.
- Select: selects the elements that meet the filter criteria (removing the others from the original list).
- Deselect: removes the elements that meet the filtered criteria, returning the remaining elements from the original list.
So, for example to find all the elements except those that contain the word "new", setup a contains filter with the deselect option.
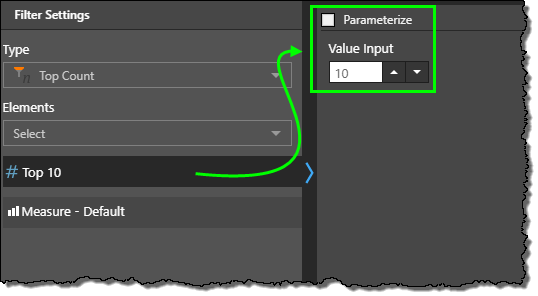
Inputs & Parameterization
Depending on the type of filter used, there will be an option(s) to provide the inputs to drive the filtering logic (like number of items, % cut-off, search text etc). The inputs can be supplied as static values or as parameters. Parameters are tools to allow the user to change the cut-off values used in the filter from the visualization canvas without needing to open and edit settings in the Wizard.
Parameters can be designed independently in the Formulate tool or as quick one-off parameters.
- Click here for a more detailed explanation of how to use quick parameters with Filters in Discover.
- Click here to read more about parameters in general.
Text Based Input
Some of the filters require text based inputs (such as contains and exact). The search terms can be entered as standard text. Without any special indicators, the search tools will assume the entire text supplied as a singular search item. The following special characters can be used to provide a list of items, or perform conditional searches:
- Multiple, comma separated terms ",": this will search each of the items in the list independently, offering the combined result.
- "AND" separated terms "&&": this will search each of the items in the list and find only those items that contain all the supplied terms.
- "OR" separated items "||": this will search each of the items in the list and find any items that contain one ore more of the supplied terms.
Data Points and Values for Filtering
When filtering elements with numerical values we are effectively choosing to filter the elements according to some data point related to those elements from the data model.
When you use Quick Filters or the more complete Filtering Wizard, the data point is heuristically determined from the query itself or the context of the query (filters etc). However, you are not limited to using these items. You are free to completely define a different data point to use for the filter logic.
As such, the data point selection in the filter wizard can be a simple measure selection or be a much deeper selection of elements from anywhere in the data model - regardless of whether it can be seen in the query itself or not.
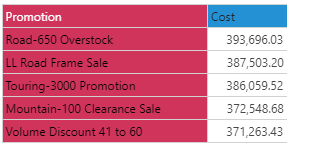
To better understand this the grid below simply shows cost by promotion. If we wanted to build the top 5 promotions by cost, we would order the list from high to low and then return the first 5 elements.
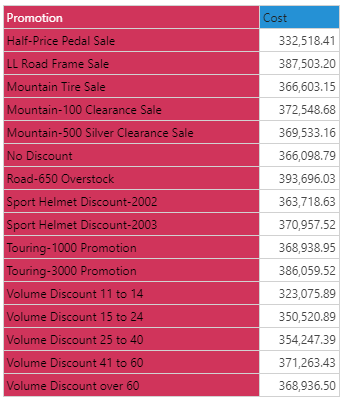
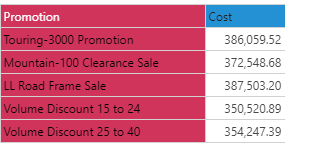
However, the user could decide to filter the items using 'Margin figures for Male customers' instead. You can see below that the resulting grid shows the same cost values for promotions, but the filtered top 5 list is different to the above.
The flexibility to define an independent data point to drive your filters is a very powerful option. To pick the items for the data point, we use the hierarchy and element pickers, described below.
Hide Query Info
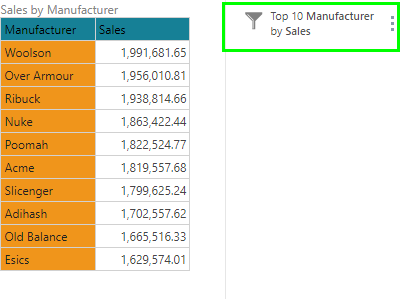
When filtering the query, the filter will appear on the canvas as a query info caption:
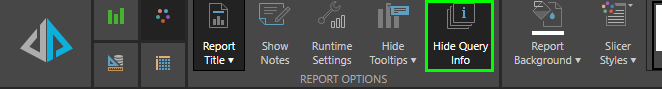
To hide this caption, while still filtering the query, enable Hide Query Info from the Design ribbon:
Position the Filtering
The filtering key is displayed on the right side of the canvas by default, but it can also be moved to the top or bottom of the canvas, or hidden.
To move your filtering key:
- Hover over the panel - the cursor will show as a move pointer (four arrows)
- Click and drag the cursor to one of the four docking zones
- When the docking zone displays a blue highlight, drop the filtering key panel
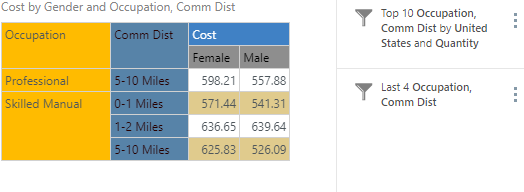
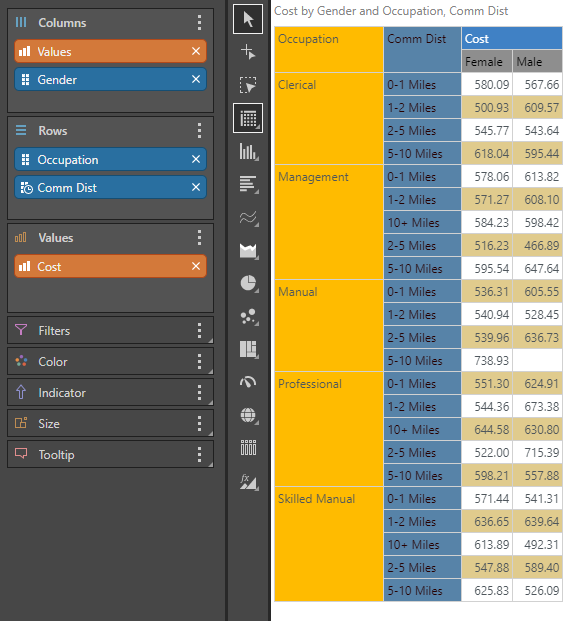
Example
In the example below, we have a grid showing cost by gender in columns, and occupation and commute distance in rows. Lets find the top 5 occupation / commute distance combinations based on female costs.
Step 1
In the Filter Targets window, click the plus sign.
Step 2
You'll see a list of all the member hierarchies that have been added to your query in the targets panel. Select the member hierarchy(s) you want to filter.
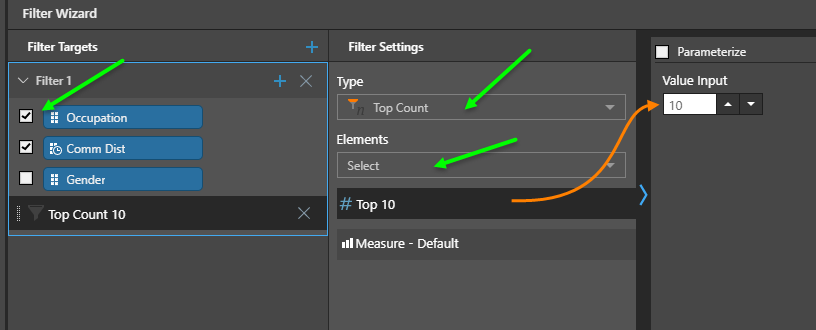
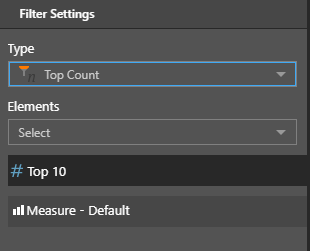
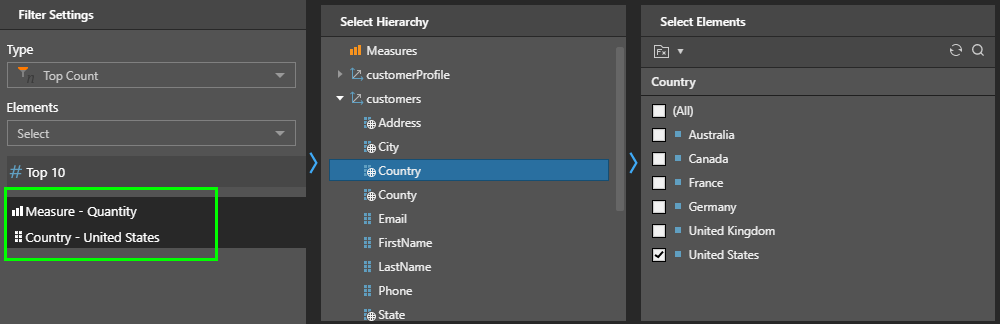
Step 3
In the Filter settings panel (seen above), select the filter type and whether to select or deselect elements. Also, make sure you set the count value that will drive the top "n" items you wish to filter for (orange arrow above).
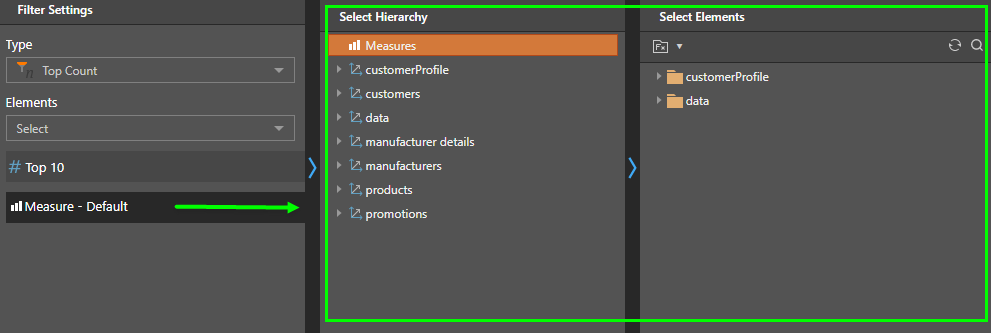
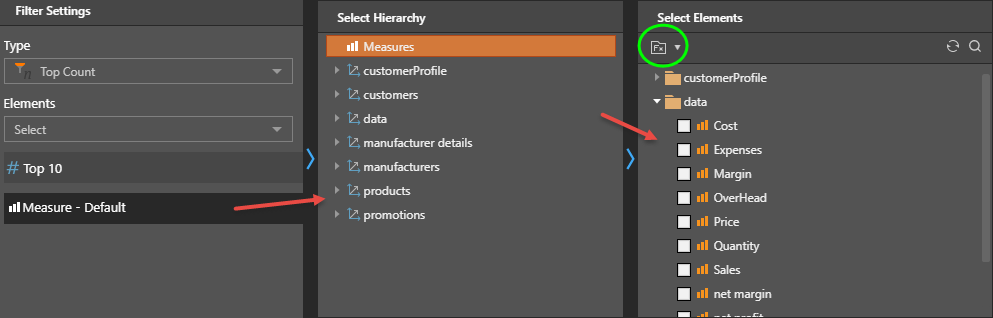
Step 4
If you do not add any data points information, the filter will run and assume that the value to judge the top "n" on is based on the default metric for the model. If you want to change this and build slightly more advanced filtering logic the next step is to define the data points that will be used as the filter metric in determining the list.
Clicking on the data point editor will expose the hierarchy tree, and for each hierarchy its elements. This will allow you to hand pick the exact definition of the numerical value that will drive the filter.
Note: you can only pick a single value from each hierarchy. If you want to pick multiple elements (or indeed drive your filter with nested calculated logic) use pre-existing custom members and sets accessible via the function library (green circle).
Step 5
In the example, our occupation / commute distance items are going to be evaluated using US quantity values.
Step 6
In the next step, we are going to further refine the top 10 occupation / commute distance items by only taking the last 4 items in that list. We will use a NESTED filter to "filter the filter" in the previous step.
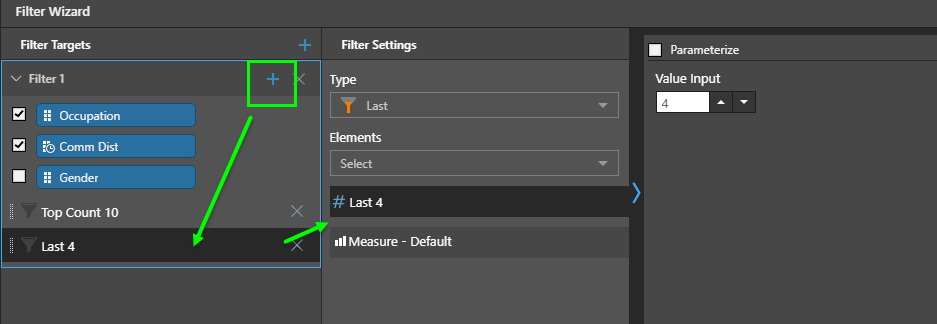
Last, click Apply to execute your filter and return the result.